Monitoring
Prometheus, Grafana
Prometheus is an open-source systems monitoring and alerting toolkit. Prometheus collects and stores its metrics as time series data, i.e. metrics information is stored with the timestamp at which it was recorded, alongside optional key-value pairs called labels.
Grafana open source is open source visualization and analytics software. It allows you to query, visualize, alert on, and explore your metrics. It provides you with tools to turn your time-series database data into insightful graphs and visualizations.
Prometheus + Grafana is almost an industry standard for monitoring, visualization, and alerting.
Attention: The monitoring can be run either as a standalone application or it is already bundled in the Farm Proxy docker stack.
Where to find monitoring
Monitoring in Grafana is available on http://[proxy-host]:3000
Metrics and queries directly in Prometheus are available on http://[proxy-host]:9090
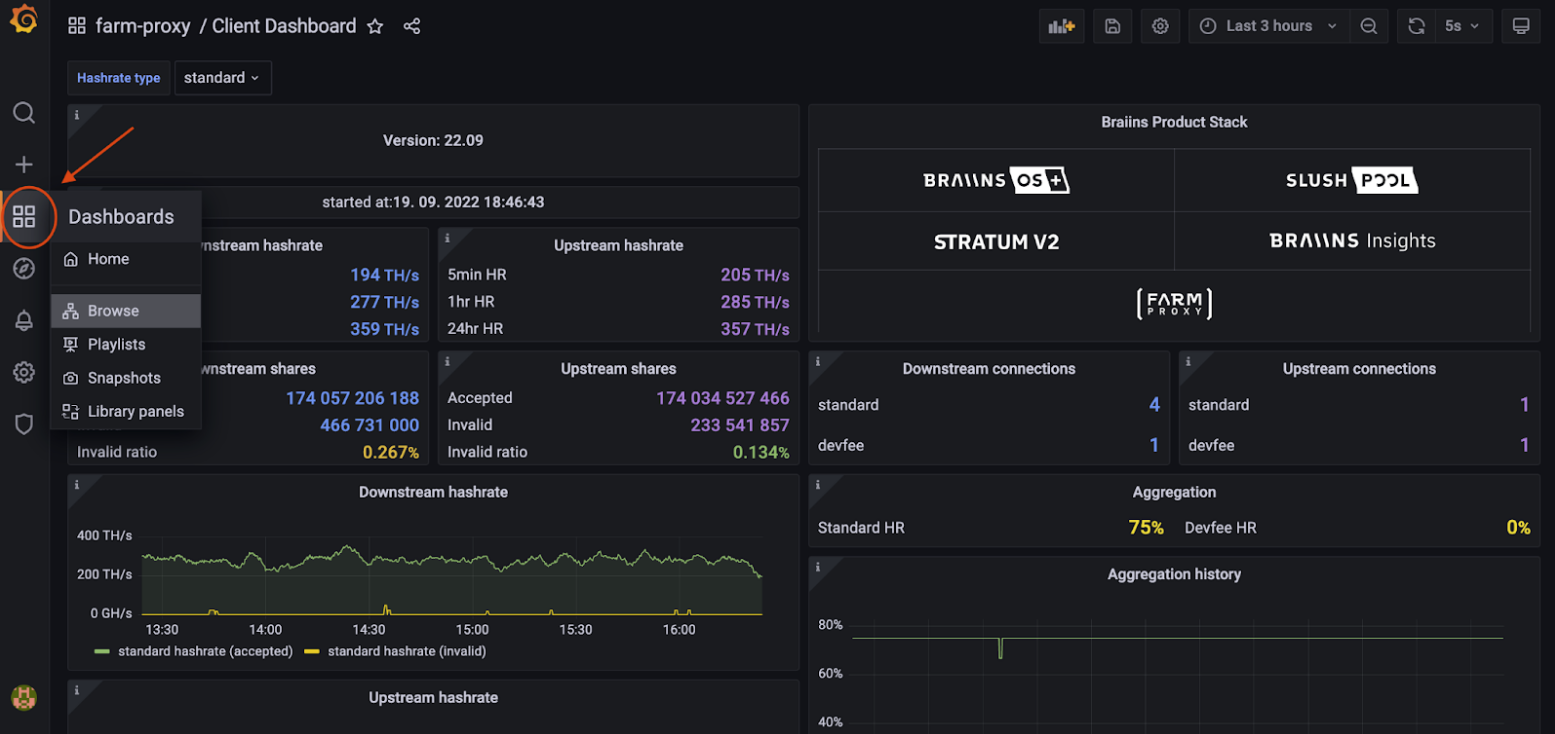
Grafana has a default dashboard called "Farm Proxy Dashboard". It provides a quick overview of the farm proxy's most important metrics and graphs. Users interested in a more detailed dashboard with further statistics and metrics can open up another dashboard called the "Debug Dashboard FP".
Picture below shows how to open the debug dashboard (4 squares on the left > Browse > farm-proxy > Debug Dashboard FP)
Farm Proxy logs
Farm Proxy is saving its logs within a Docker container. Docker is configured to store a maximum of 5 GB of logs. Log rotation and compression is in place. The number of log files is set to be 50 and the logic is that the oldest file is dismissed and a new one is spawned. The maximum size of 1 file is 100 MB. Here are some useful commands for investigating the logs (for more detail see docker logs --help):
- all available logs:
- last 200 logs:
- logs from last 20 minutes:
- logs since timestamp:
- logs in time interval:
Logs are saved in:
Prometheus and Grafana logs
Similar to Farm Proxy logs, Prometheus and Grafana logs can be queried as well (they are all docker logs, but from different docker containers). Some basic examples are presented below:
- All available Prometheus logs:
docker logs prometheus - All available Grafana logs:
docker logs grafana. Arguments like tail, since, until can be used here as well.
Prometheus and Grafana logs are handy when some of those containers are not running or trying to constantly restart. Logs will usually reveal the root cause of this. When the host server of Grafana and Prometheus is out of disk space or memory, it can cause the containers not to run. The Log will show this.