Dashboards
Introduction
Grafana is an industry standard for monitoring, visualizing and alerting.
Grafana is also great for its modularity and openness to create its own graphs and visualizations. It certainly requires familiarity with PromQL, otherwise it is very straightforward to get familiar with.
To make things simple and easy to start with we have prepared quite an extensive dashboard called "Farm Dashboard". The dashboard contains the most important metrics and their visualization, while being reasonably interactive and it has the ability to be broken down in detail if needed.
If the user wants to include his own graphs, remove the existing ones, or modify the dashboard layout it is fully open for editing.
Overview
The dashboard is divided horizontally into 7 segments, called rows. First row is called Overview. This section displays all the key information in a simple, easy to understand manner.
Users can display all the graphs based on the global filters, which are present on the top left hand side of the dashboard highlighted in pink. The available filters are:
- OS - operation system of the miner, either Braiins OS or Stock firmware,
- Building - this variable reflects defined IP ranges, see more about ranges here,
- Interval - time span for the PromQL queries which are based on the moving aggregation functions (like "rate" as moving average). The lowest value is set to 5 minutes, the reason being that Prometheus is set up to scrape up data once per minute so that moving aggregation functions need a higher time span than the scraping interval.
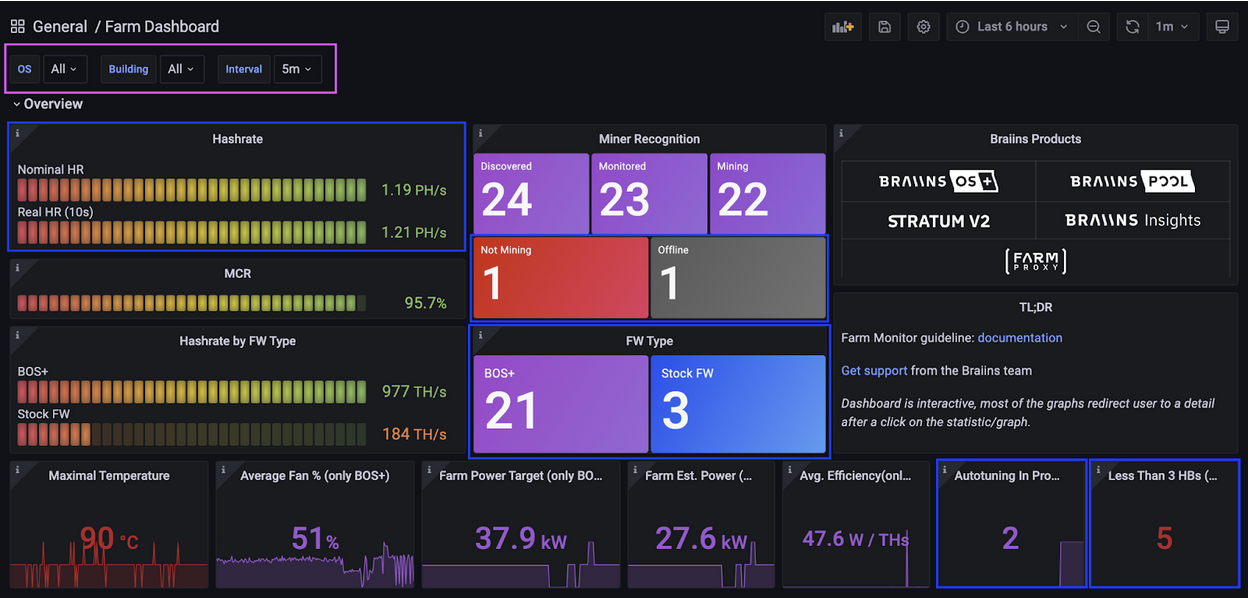
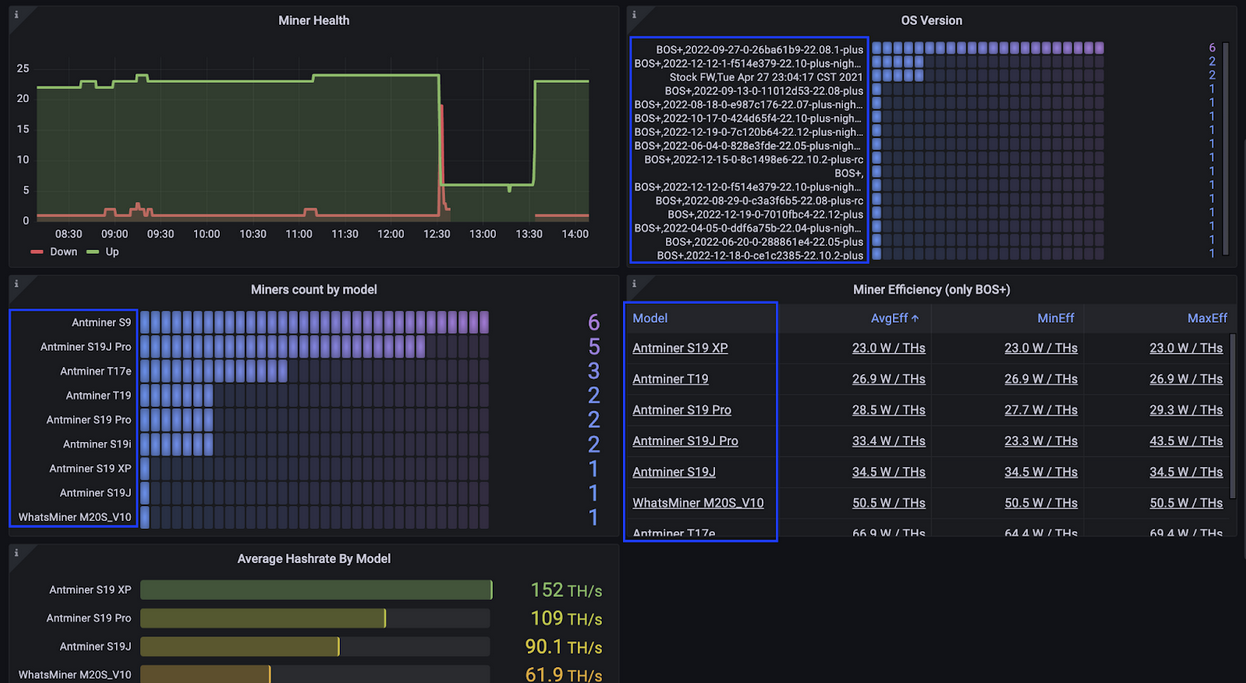
Parts highlighted in blue will lead you to a drill-down report listing the individual instances (miners).
Hashrate
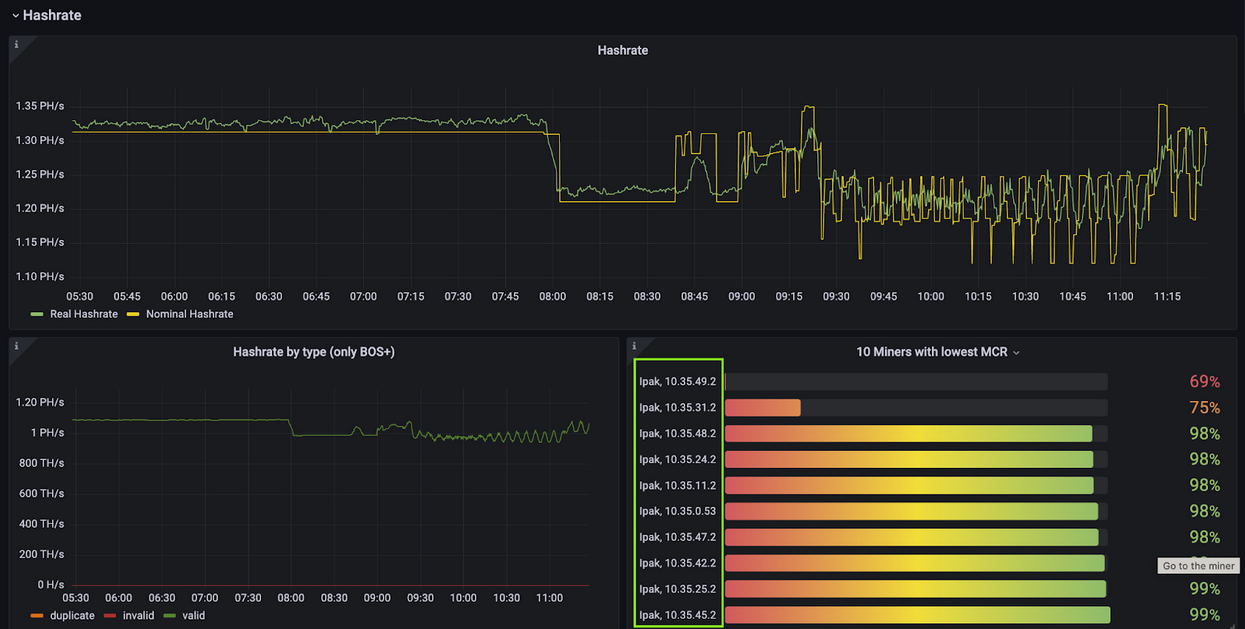
Second row is dedicated to Hashrate. The list of The 10 Lowest MCR Instances redirects clients after clicking to the miner GUI (see highlighted green rectangle) to the list of the 10 miners with the lowest MCR. Login to the miner is required as usual.
Temperature Control
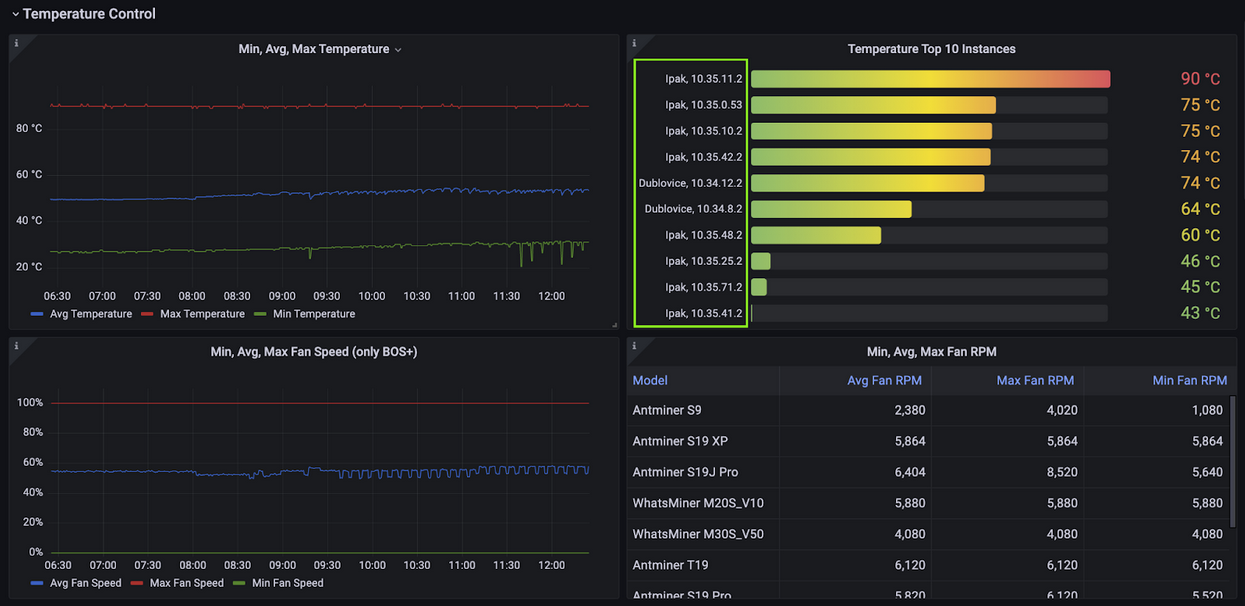
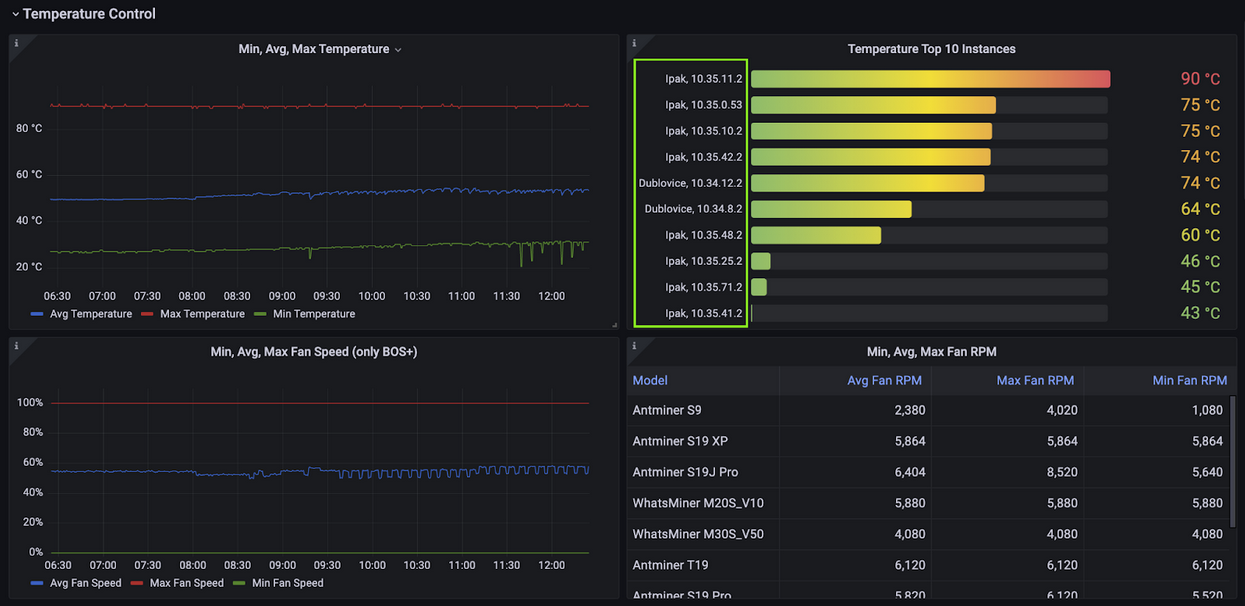
Third row is dedicated to Temperature Control. The list of Temperature Top 10 Instances redirects clients after clicking to the miner GUI (see highlighted green rectangle). Login to the miner is required as usual. Fan speed is available only for Braiins OS devices since Stock FW doesn't expose such a metric. Fan RPM is calculated from all the devices - both OS, Braiins OS and Stock FW.
Mining Pools
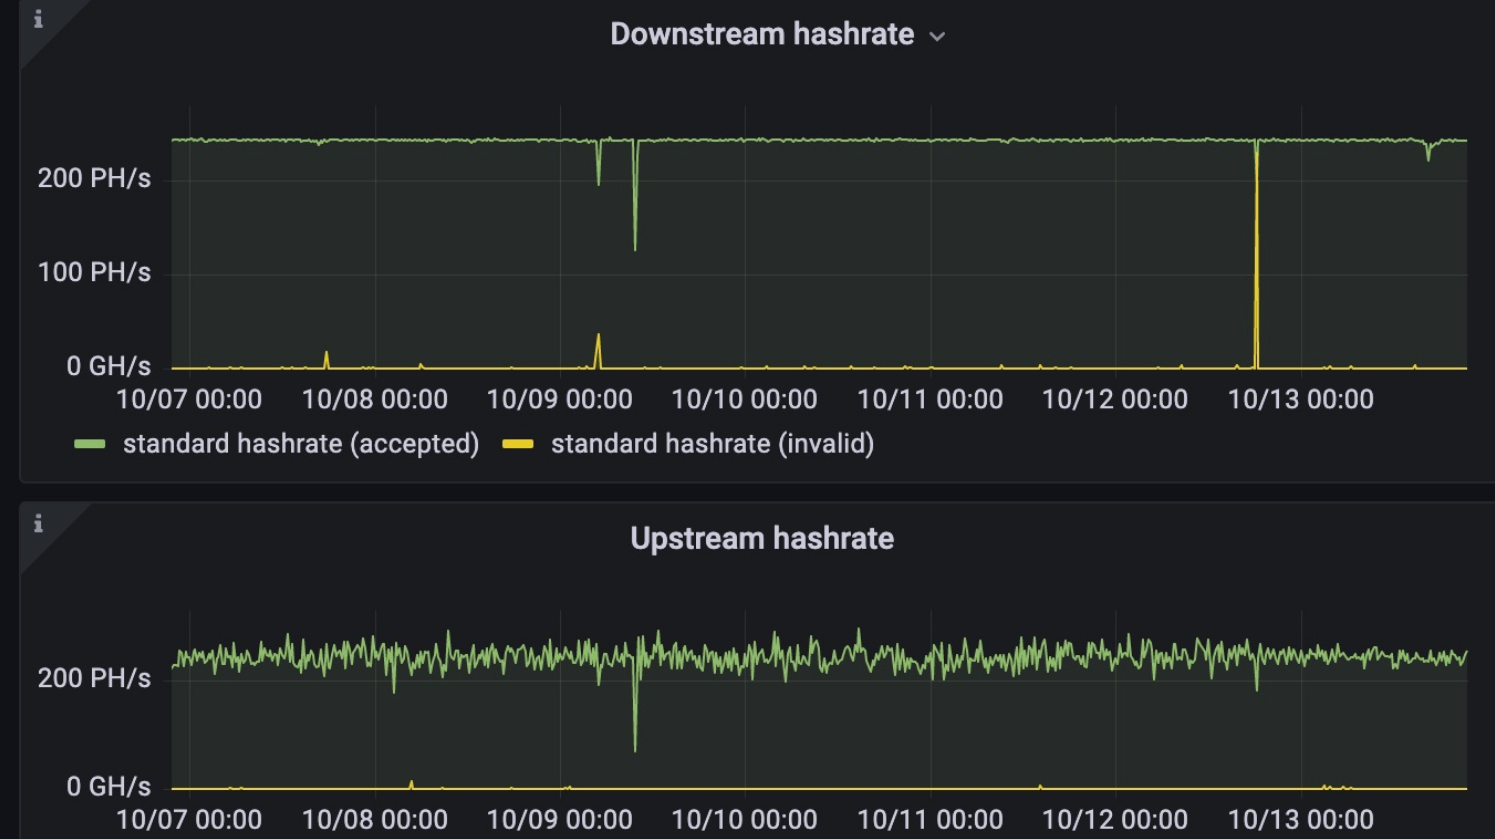
Fourth row represents visualizations of the mining pools data. Blue rectangles redirect users to the list of instances, where the specific pool/protocol represents the global filter.
Miners
Fifth row represents relevant metrics regarding the miners. Blue rectangles redirect users again to the list of instances with detailed information.
Power Target
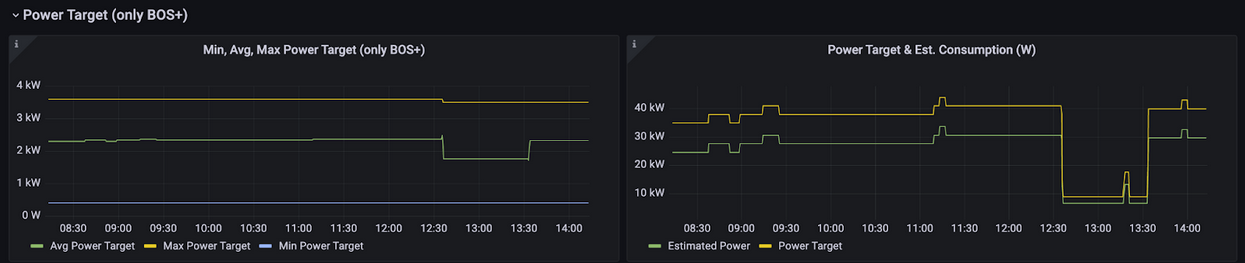
Sixth row represents graphs of the power target and consumption. Those are available only for instances running on Braiins OS since Stock FW doesn't expose any power related data.
Users
Seventh row, the last one, represents stats and visualizations for the pool users. After clinging on the data in the blue rectangle, the users are redirected to the list of instances with more detailed information.
Exporting Data from Tables
To export data from a table in Farm Monitor, follow these steps:
- Click on the triple-dot menu at the top of the visualization.
- Select Inspect > Data from the dropdown menu.
- A side panel will slide out on the right, displaying the table version of the data.
- Click the blue "Download CSV" button to export the data.
This will allow you to easily analyze the data in tools like Microsoft Excel or Google Sheets.
For more details, you can also check out the official Grafana guide.